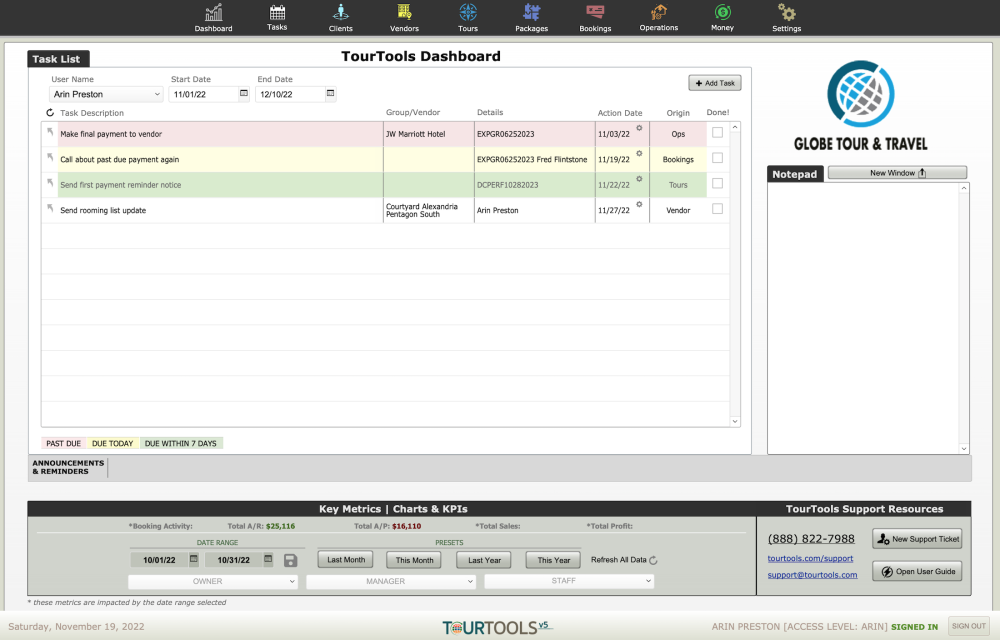
So, to begin, the TourTools Dashboard appears when you open the TourTools™ software solution.
The large Module Navigation Buttons at the top of the screen allow quick access to the primary modules of the system. There is a Notepad are for keeping track of random thoughts, task, notes as needed – these are user specific.
At the top of the Dashboard, you will be welcomed by name (if not, see “Workstation/Staff Setup” section just prior to Chapter 1) and a date range will be specified by the Start and End Date fields.
Any Tasks (explained in more detail in Chapter 9) assigned to you and due within that date range will appear in the Task List. To change the date range, use the small calendars that appear when you click in either or both date fields. To look at a colleague’s tasks, if they are out sick for example, click in the User Name field and make a selection. Tasks are color coded: red if past due, yellow if due today, green if upcoming within the week, and no color if a task is farther out than a week.
At the bottom of the Dashboard, there is a section related to key metrics and performance indicators for your company. Some of the charts and metrics available here can be shown for a specific date range by using the start/end date selectors. The various charts and metrics are visible/available based on log in permissions – some are only accessible to those logged in as Owner or Manager. If you are not interested in key metrics, this section can be disabled in User Settings and replaced with System Module buttons alternatively.
Default Setting/View – Key Metrics

Alternate Setting/View – System Modules

If you have any questions that are not answered here Contact TourTools Support for assistance.


Post your comment on this topic.